There’s more than one way to hook a reader. Some journalists are picking up yarn and crochet hooks to create tactile works of data visualization.
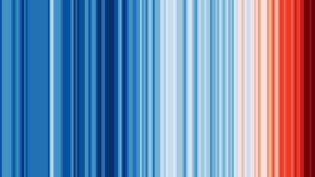
If you’ve only seen one crochet data viz project, you’ve probably seen a temperature blanket, where each row is color-coded to reflect the highs and lows for a year. Can this be used for other data? Sure. Some use the technique to visualize their mental health and this TikTok account recently went viral for cataloging her, um, digestive regularity. Yarn has also been used to visualize train delays in Munich, infant sleep patterns, Russian population growth, and daily news feeds.
The journalists I spoke with talked about crochet as a creative practice, a personal hobby, and an academic interest. Some of their work has been published by their newsrooms, but all talked about how fiber arts like crochet have encouraged them to…
